Social and cognitive benefits of mapping – Sal Freudenberg
What’s the best move? – Andrew Clay Shafer
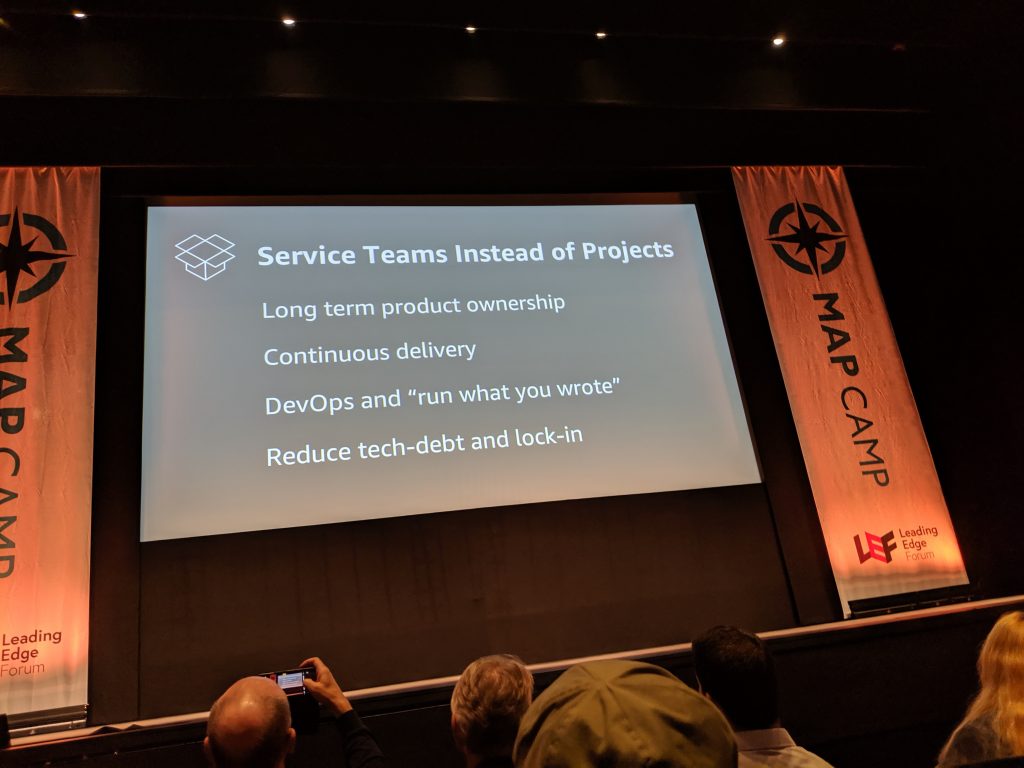
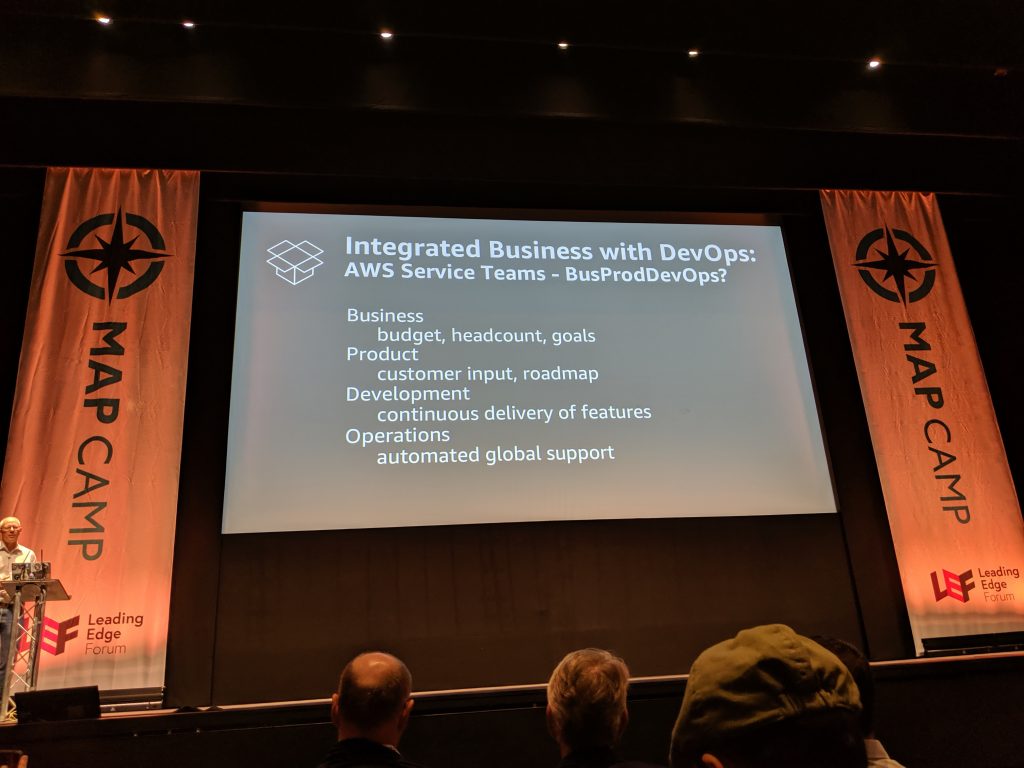
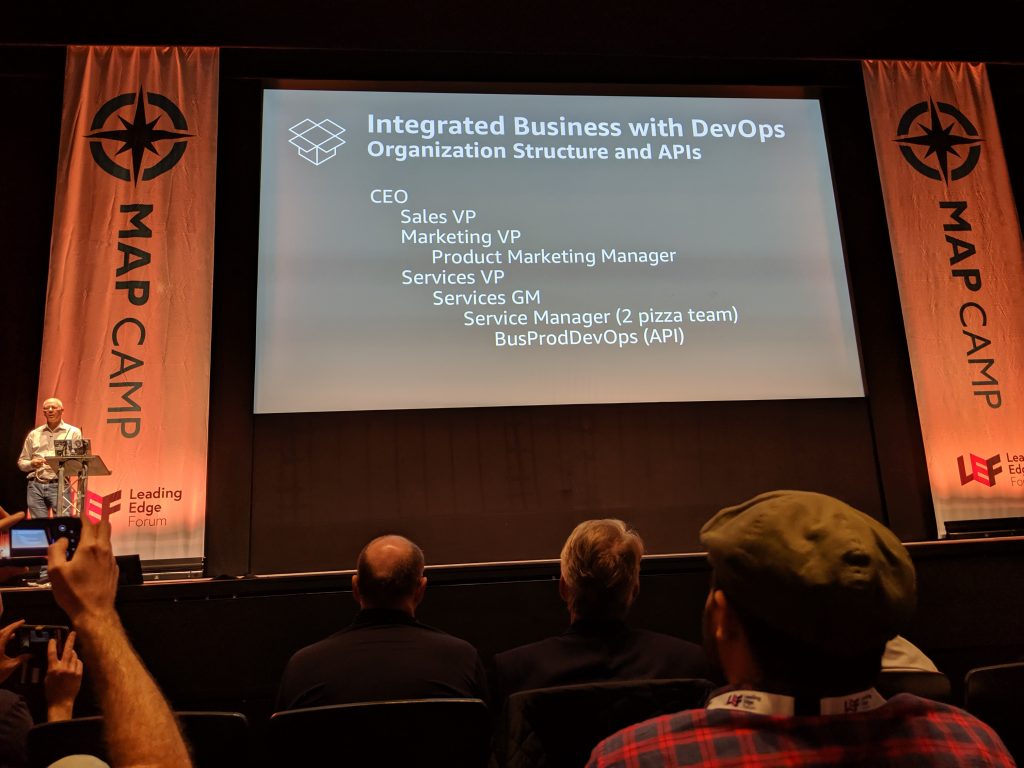
Open source and Maps – Adrian Cockcroft
Adrian Cockcroft: VP Cloud Architecture Strategy at AWS
Helping individuals and organisations sense & respond to a rapidly changing world

Adrian Cockcroft: VP Cloud Architecture Strategy at AWS
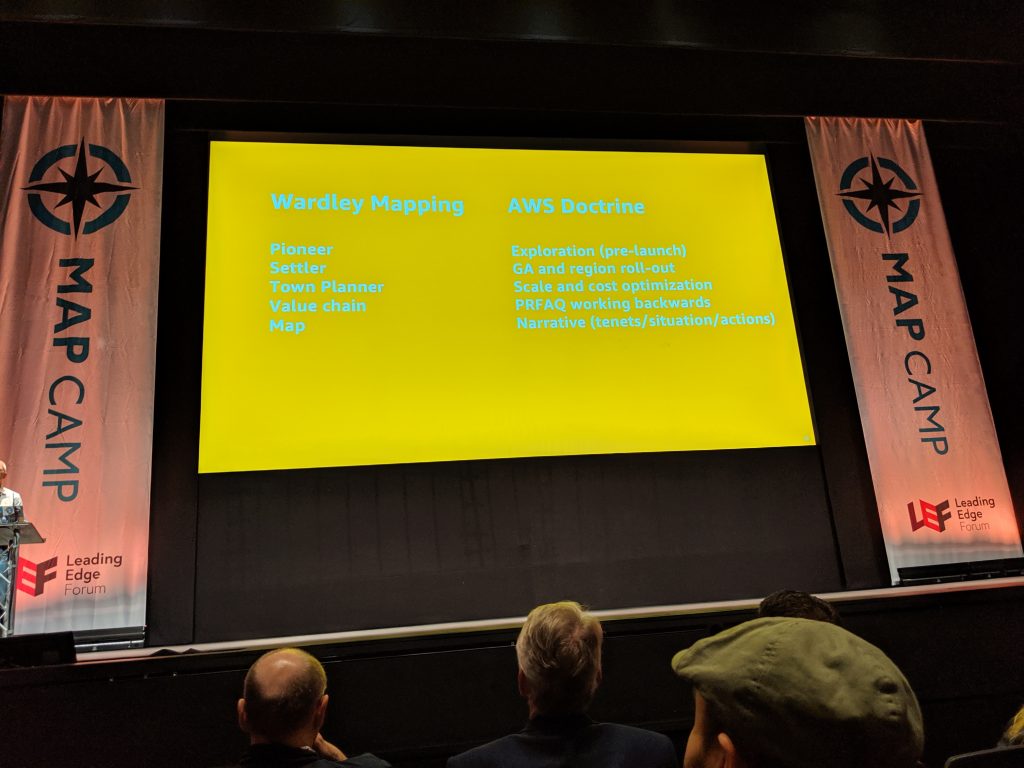
This workshop introduces Wardley Mapping as a technique to understand the chain of components an organisation needs to serve user needs. It creates situational awareness by mapping the maturity of each component, and the visibility of the component to the user. It allowing organisations to better strategise and improve their effectiveness and competitiveness.
The workshop can be delivered in 60 to 120 minutes. It’s team-based and can be run for any number of teams.
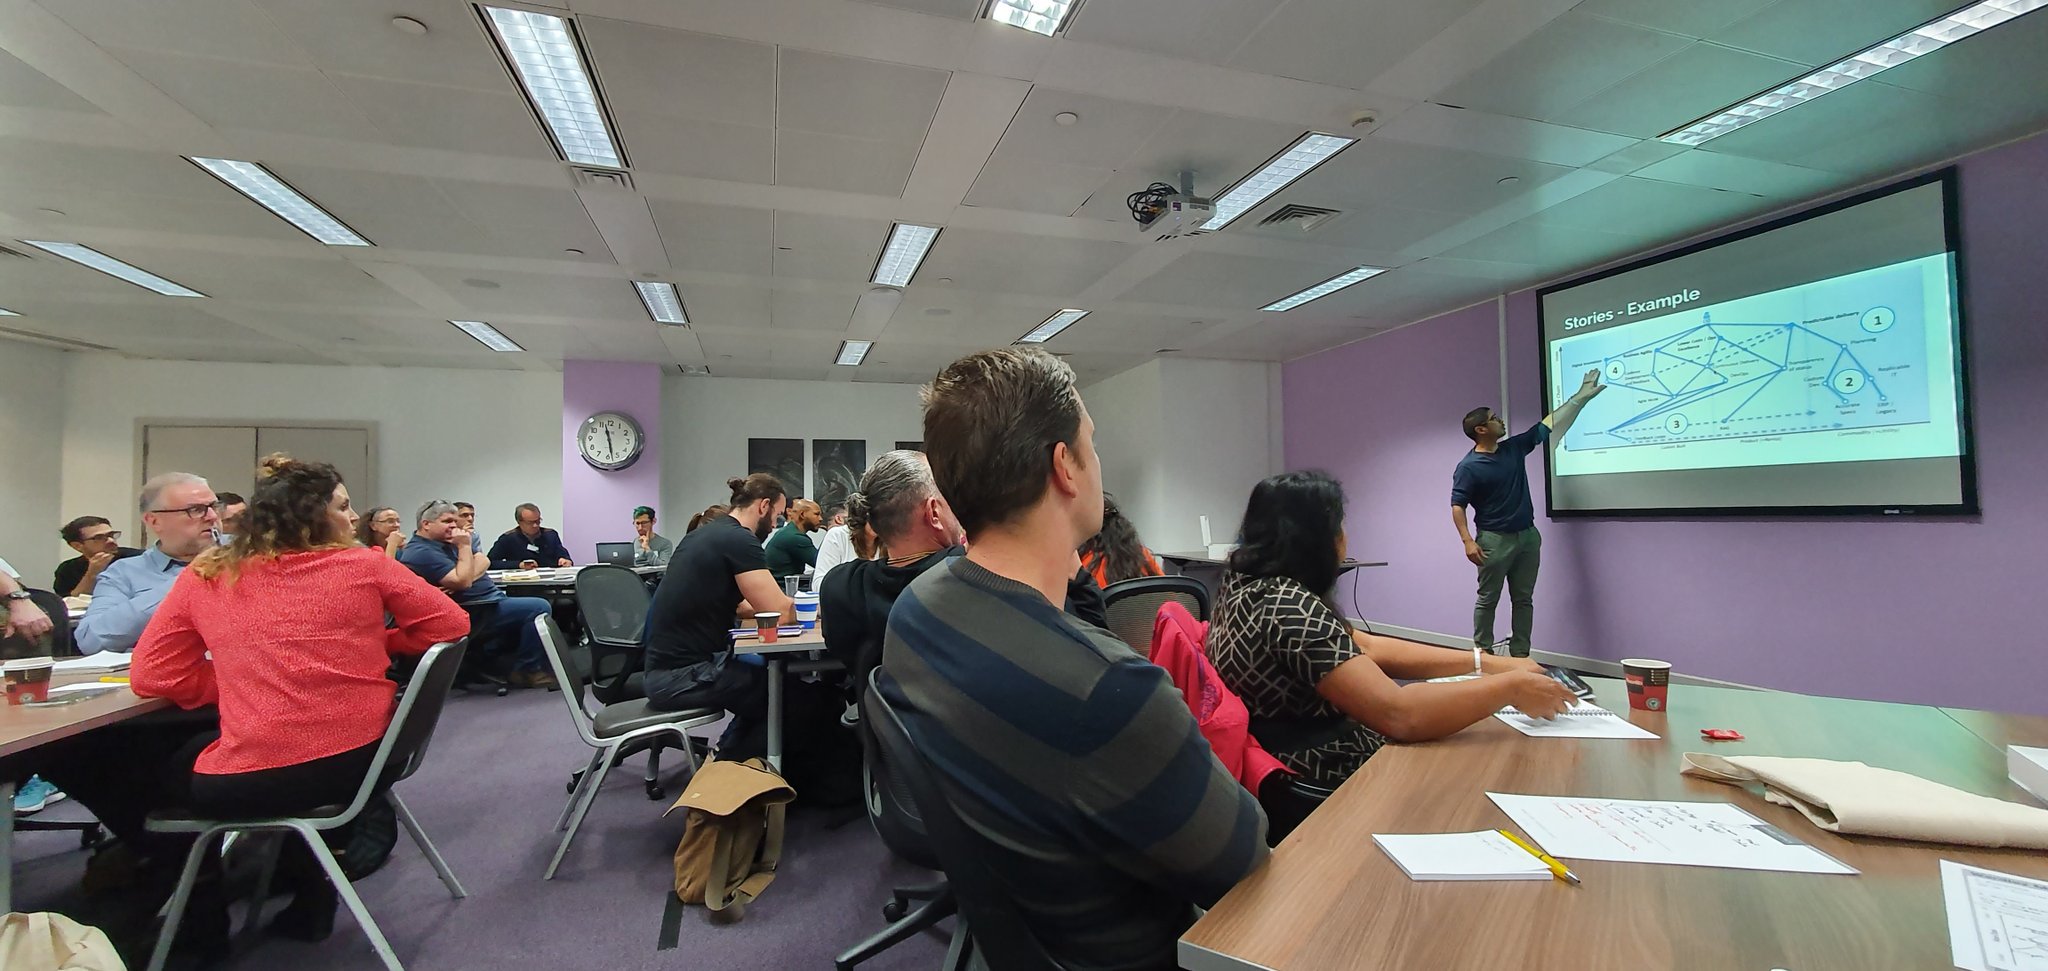
I’m impressed w/ @dlatchana’s #ATLDN workshop on Wardley Mapping: Value Delivery and Competitiveness, so practical for many businesses. pic.twitter.com/Yn8EGuqmrw
— Michael R. Lorek (@m_lorek) October 18, 2019
Thank you to Philippe Guenet for working with me in developing the workshop.
Wardley Mapping is conceived by and is kindly shared by Simon Wardley.
The envisioning workshop is a group facilitation activity which:
It helps ensure the co-created vision, strategic alignment and execution are in keeping with the elements described in Starting an Engagement.
Participants should be the leadership team, stakeholders and key representatives from the execution team (aka delivery team). Ideally, there should be between five and nine participants, plus the workshop facilitator(s).
Duration: Typically 3-4 hours
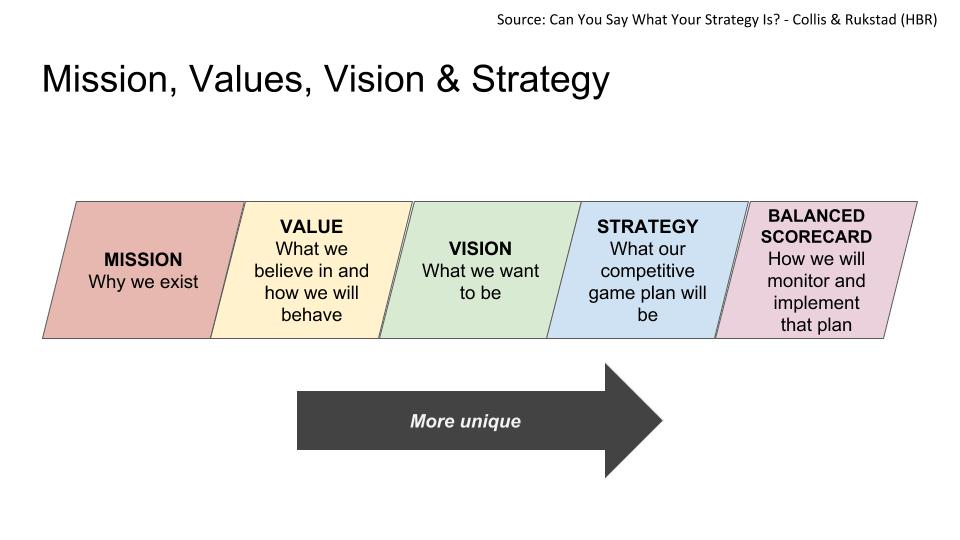
To gain alignment it’s important that all participants co-create the vision. The vision describes an ambitious and motivational future-state for the business. This vision is written as a vision statement, which has the following qualities:
To move with velocity to drive profitable growth and become an even better McDonald’s serving more customers delicious food each day around the world.
McDonald’s Vision Statement
We’ll save money by eliminating impediments to deliver a frictionless customer experience, which empowers our front-of-house colleagues.
A Vision Statement created by a team in a FTSE 100 company
Brainstorm and agree on three or four measures of success. These ensure the right benefits, behavioural changes and consequences will be achieved which will support the vision.
Some examples of measures of success:
Measures of success should be found within the vision statement. The following measures of success are implied in the McDonald’s vision statement:
Now facilitate the participants to brainstorm a number of strategies which will meet some or all of the measures of success, which they believe will help to fulfil the vision.
If the vision is transformational, encourage the creation of strategies which will test long-held assumptions.
Participants can write their strategies individually or in pairs. Each strategy idea should be written on post-it notes. Once participants have written a few each, remove any which the participants agree are duplicates.
A strategy is something which gives consistency over time and contains the essence of how you’re going to be different
Gary Hamel’s definition of strategy
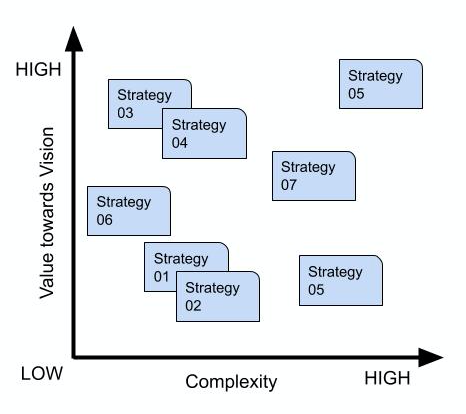
These strategies should now be ordered relative to each other. They should be ordered by their degree of perceived value towards achieving the vision, and by the perceived complexity of achieving the strategy.
There are a number of ways to understand and measure complexity. For example, consider Liz Keogh’s Estimating Complexity and my RUDE technique.
This stage of the workshop creates a spread of strategies where the following can be identified and discussed:
Participants should then reflect on the distribution of strategies, and be encouraged to debate, modify, reposition, and possibly remove strategies. This helps the participants create an ordered backlog of strategies.
Since each strategy has a degree of uncertainty, each strategy should be treated as a hypothesis to be proven or disproven through rapid experiments. Therefore, following the workshop, with close support of their leaders and stakeholders, execution teams should test and learn whether the strategies can be achieved.
These strategies should be tested through the innovations, products and services built by the execution teams. A Lean Startup approach should be employed utilising concepts such as the Minimum Viable Product. In partnership with the workshop participants, teams should be disciplined and ruthless in discontinuing ideas which don’t meet the strategic objectives.
A possible set of evaluation criteria can be the one described by the Ash Maurya:
Another set of criteria could be testing for problem-solution fit and product-market fit.
A final stage of the workshop is for the participants to agree on how to brief and support execution teams to address two or three strategies from the top of the strategy backlog.
The continuation of existing strategies, innovations, products and services should be judged against their alignment to the vision and its measures of success.
A pivot is a change in strategy without a change in vision
Eric Ries
A cadence structure should be agreed and set-up for the participants to regularly meet, review and adjust the strategic fit to the vision. This should be done in union with the execution teams.
To ensure on-going alignment and support for execution teams, execution teams should be encouraged to make use of visual management techniques which demonstrates how their current and future work is testing the agreed strategies. The Cone-shaped Backlog is one such visual management technique.

In this talk learn how the Project/Programme Portfolio Office can support their business in recognising and handling uncertainty. Learn how the PMO can coordinate the balance and flow of initiatives through each stage of the delivery lifecycle, through to delivery of value.
Here’s an approach I’ve found successful when helping teams ensure their backlog supports optionality, handles uncertainty and continuously adjusts so their goals and strategies are aligned to their vision.
The backlog is made-up of backlog items. Each item represents a business goal, which when delivered by the team, will provide a beneficial outcome to the business and its customers/stakeholders.
Qualities of the backlog:
I often encourage teams to visualise the backlog in a cone-shape in this manner:
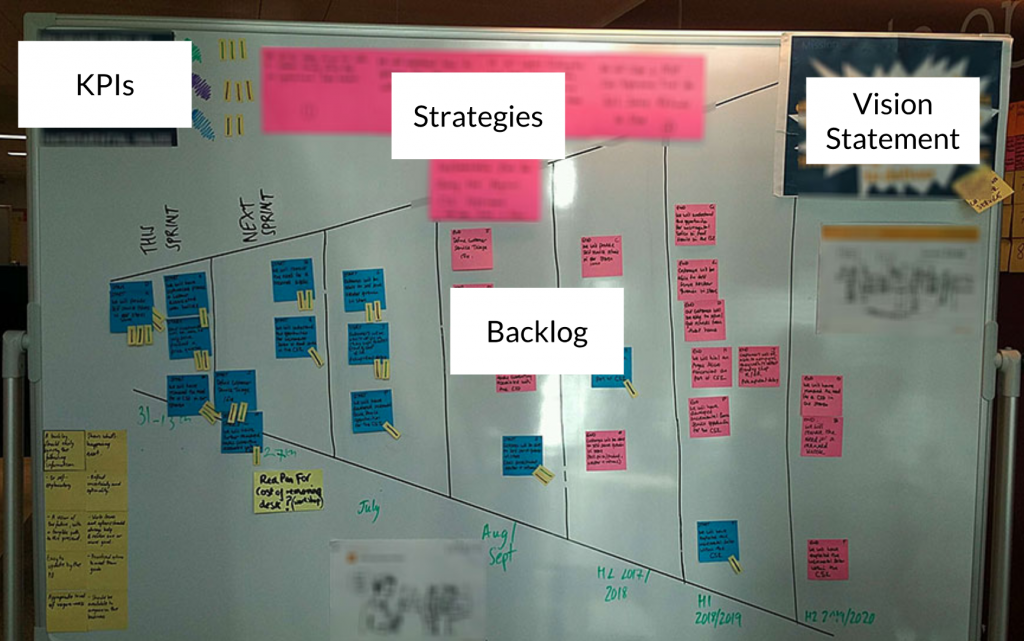
As shown in the photo above, to enable continuous alignment across the business, there is additional information I advise teams to use: